· Joseph · AI & Machine Learning · 5 min read
Use Grafana MCP with Gemini and n8n

The Model Context Protocol (MCP) is extremely useful. An AI assistant helps you decide when and how to use connected tools, so you only need to configure them. After integrating MCP logging management systems into several of my projects, it has saved me a significant amount of time.
In this article, I’m going to integrate Grafana with the Gemini CLI and n8n. I will chat with the Gemini CLI and n8n and have them invoke the Grafana MCP server.

TOC
Prerequisites
I’ll be using these tools, so you may need to install them first.
There are many ways to set up the Grafana MCP. I’m going to connect to the Grafana MCP server using Docker in the Gemini CLI and using a binary file in n8n. I ran Grafana in Docker on my localhost (http://host.docker.internal:9120), but you can point to your own Grafana service.
Grafana Service Account
A service account token allows an MCP client to connect and authenticate with Grafana. Therefore, we need to create a service account and generate a token for it. Let’s go through the steps:
- Click the menu on the left,
- Click
Administration, - Click
Service accountsunderUsers and access, - Create a service account by clicking
Add service account, - Generate a token by clicking
Add service account token. - Copy your token!


Once you have the token and Grafana URL, you can set them as environment variables for the Grafana MCP server.
Gemini CLI using Grafana MCP
Don’t worry; it’s quite simple if you remember my article about the Figma MCP. I’ll follow that guide to use Docker to connect Gemini and Grafana.
"mcpServers": {
  "grafana": {
    "command": "docker",
    "args": [
      "run",
      "--rm",
      "-i",
      "-e",
      "GRAFANA_URL",
      "-e",
      "GRAFANA_API_KEY",
      "mcp/grafana",
      "-t",
      "stdio"
    ],
    "env": {
      "GRAFANA_URL": "http://host.docker.internal:9120",
      "GRAFANA_API_KEY": "YOUR_GRAFANA_SERVICE_ACCOUNT_TOKEN"
    }
  }
}
When I type /mcp in the Gemini CLI, it will list all available tools. I can also ask Gemini to do things like Summarize grafana board, get the "Docker Prometheus Monitoring" board summary, or query_prometheus rate(node_cpu_seconds_total{mode="system"}[5m]). 
Now, let’s see how to use Grafana with n8n.
N8n using Grafana mcp
I did not install Docker in the n8n container, so I decided to run the mcp-grafana binary file directly.
Download here: https://github.com/grafana/mcp-grafana/releases
Just run these commands inside your container to install it.
$ wget https://github.com/grafana/mcp-grafana/releases/download/v0.6.2/mcp-grafana_Linux_x86_64.tar.gz
$ tar -xvzf mcp-grafana_Linux_x86_64.tar.gz
After that, n8n nodes should be able to run Grafana using the /home/node/mcp-grafana command. Before we try the command, we have to add the n8n-nodes-mcp community node to n8n and set up an AI agent workflow. Let’s take a look. 

- AI Agent Node: I set the system prompt to
You are a helpful Grafana MCP assistant, and then triggered it with theConnected Chat Triggernode. - Google Gemini Chat Model: The important thing is that the host for the
Credential Google Gemini(PaLM) Apishould behttps://generativelanguage.googleapis.com. Then, paste your Gemini API key into theAPI Keyfield. - Simple Memory: The
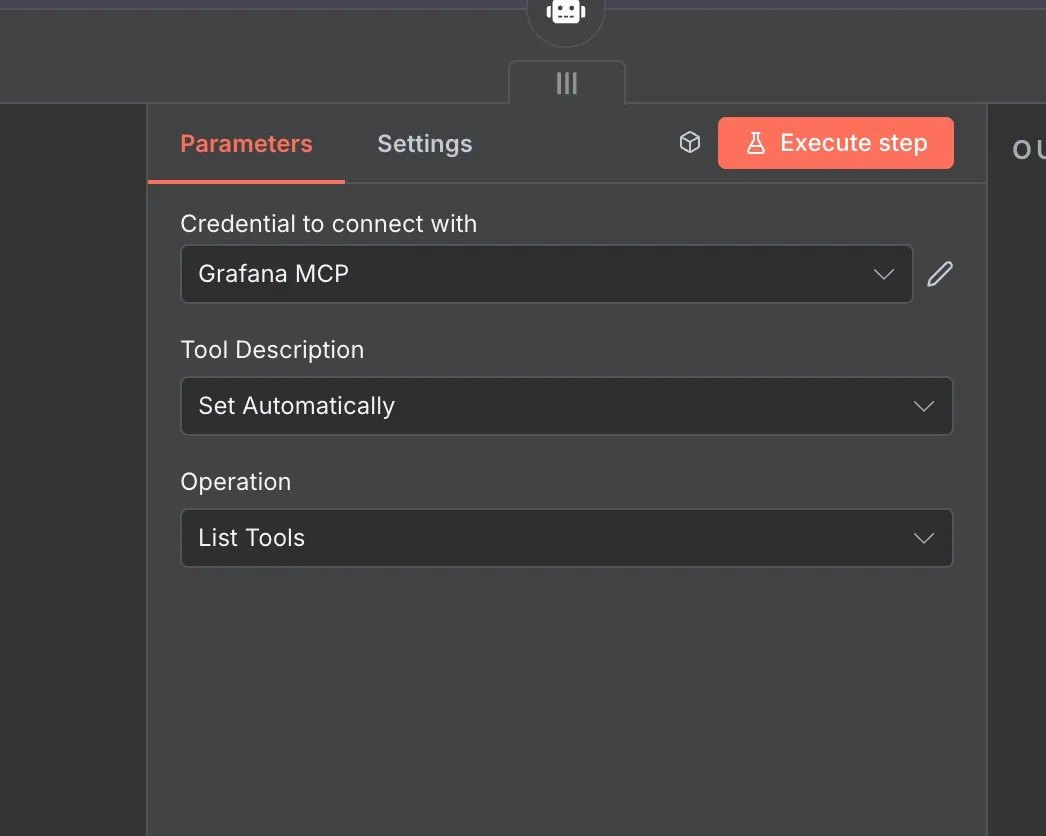
Context Window Lengthis set to10because we need to communicate with the assistant multiple times. - MCP Client Tool - listTools: Remember to use the
MCP client toolwe just downloaded from the community. For this node, I set theOperationtoList Tools.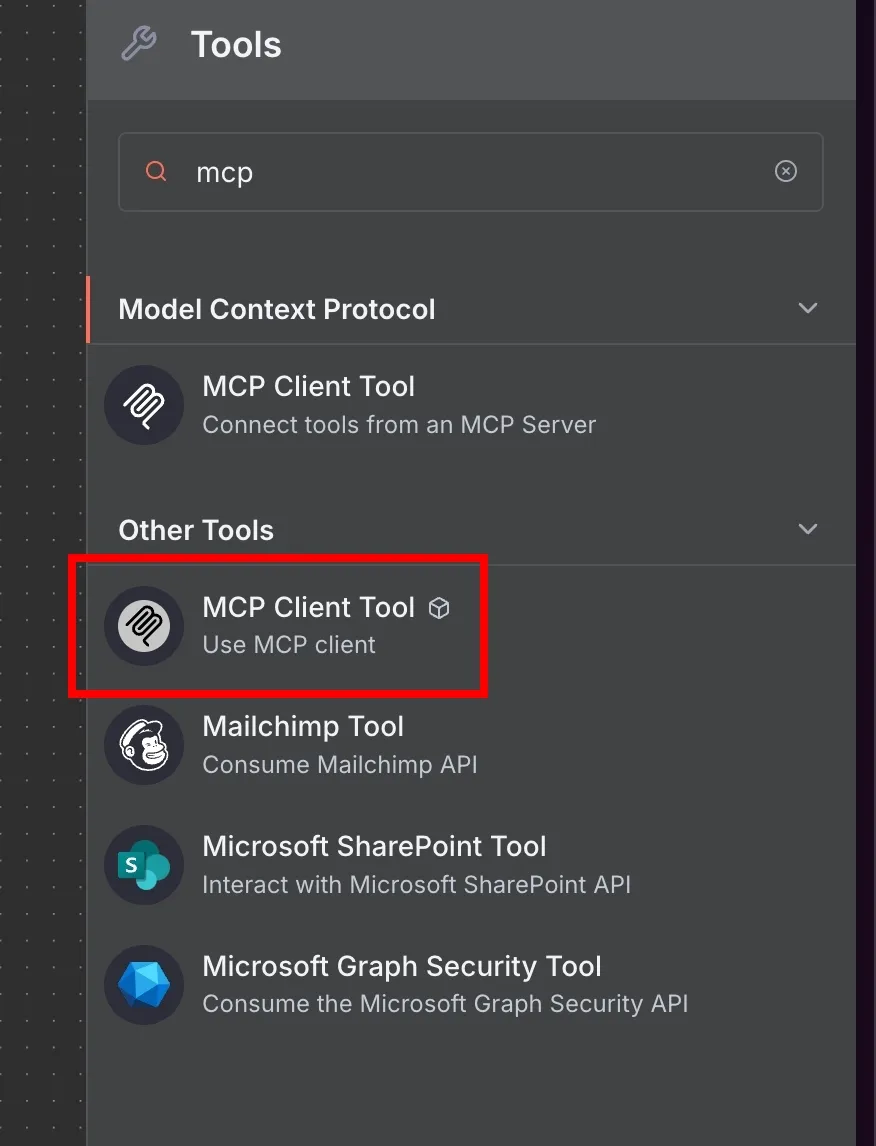
- MCP Client Tool - executeTool: For this node, I set
OperationtoExecute ToolandTool Nameto{{ $fromAI('tool') }}. Pay attention to the green area that saysLet the model define this parameter—just click it!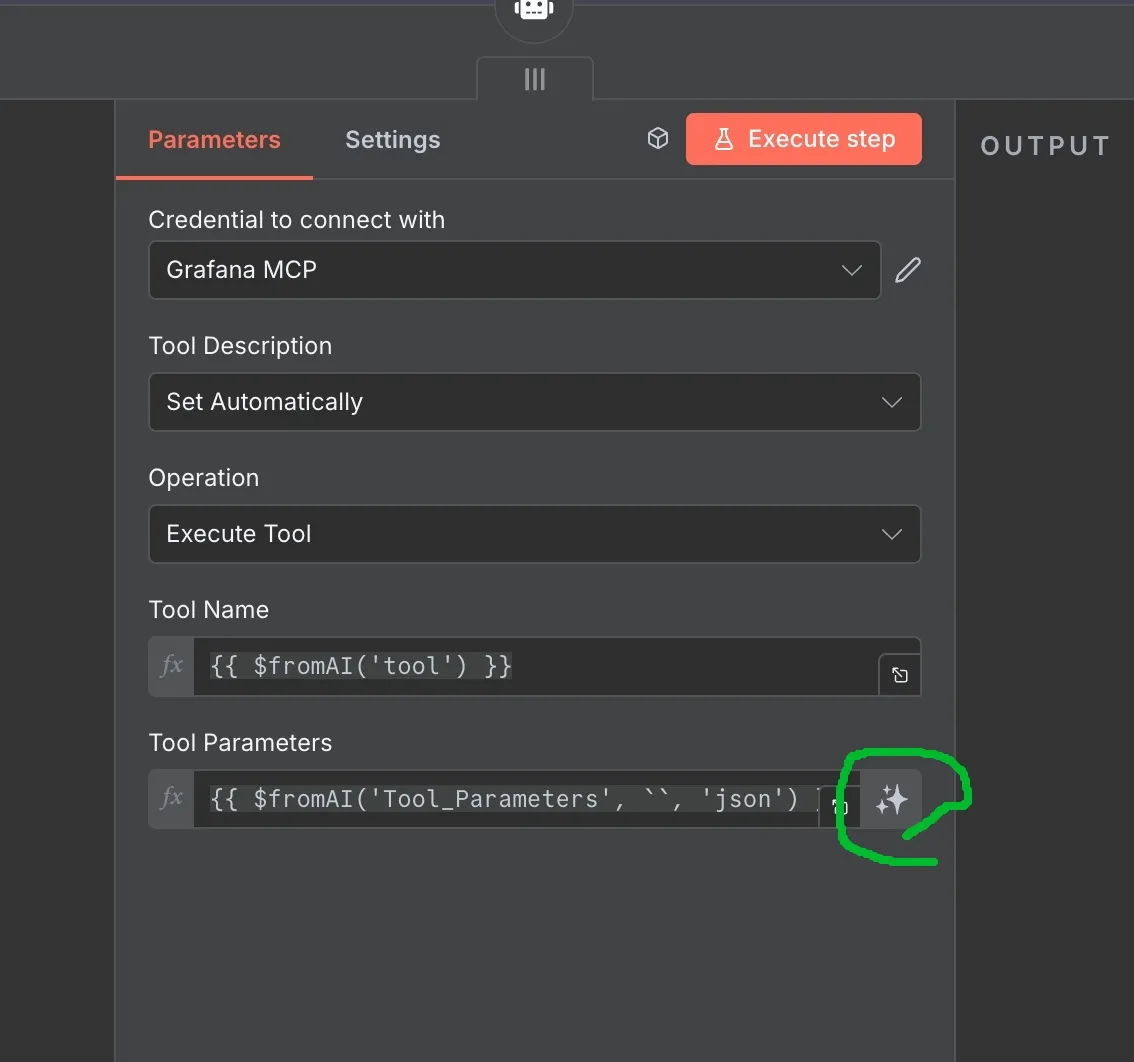
- Grafana MCP Credential: This credential connects using
Command Line (STDIO). Set the command to/home/node/mcp-grafanaand set theGRAFANA_URLandGRAFANA_API_KEYenvironment variables.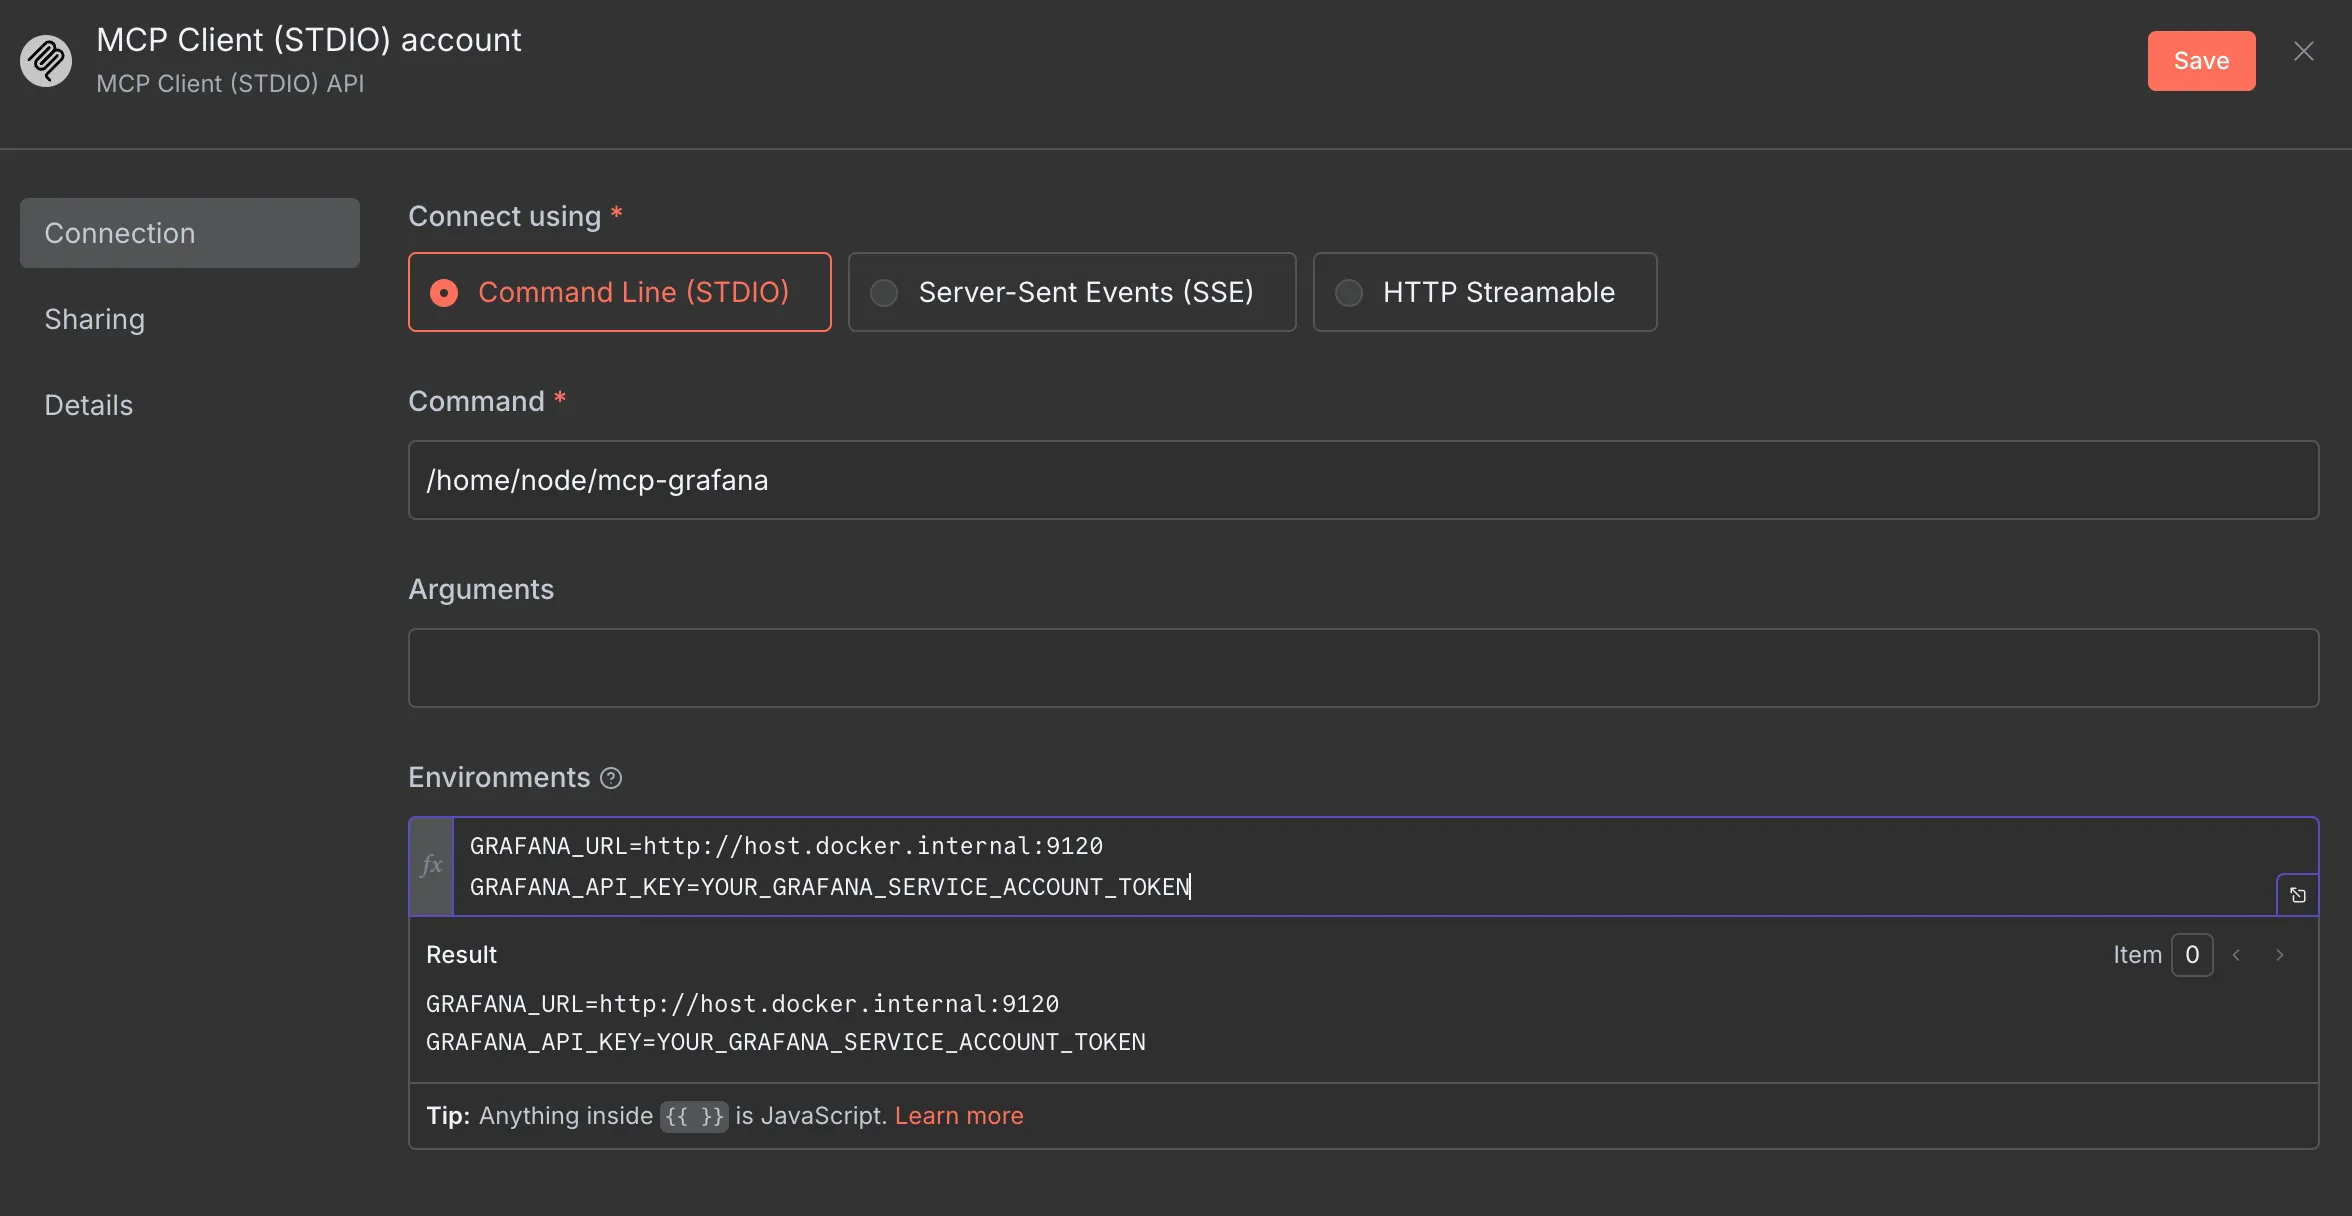


Okay! Let’s try some prompts for this MCP:
{ “tool”: “query_prometheus”, “Tool_Parameters”: { “datasourceUid”: “PBFA97CFB590B2093”, “expr”: “rate(node_cpu_seconds_total{mode=“system”}[5m])”, “queryType”: “range”, “startTime”: “now-1h”, “endTime”: “now”, “stepSeconds”: 60 } }
The Prometheus query returned time series data for the rate of system CPU usage over the last hour, sampled every 60 seconds, for 11 CPU cores (labeled 0 through 10).

Here is a summary of the data for each CPU core:

CPU 0:
  Latest Value: 0.0148
  Average Value: 0.0155
CPU 1:
  Latest Value: 0.0061
  Average Value: 0.0059
CPU 2:
  Latest Value: 0.0064
  Average Value: 0.0058
CPU 3:
  Latest Value: 0.0037
  Average Value: 0.0053
CPU 4:
  Latest Value: 0.0044
  Average Value: 0.0054
CPU 5:
  Latest Value: 0.0065
  Average Value: 0.0053
CPU 6:
  Latest Value: 0.0050
  Average Value: 0.0060
CPU 7:
  Latest Value: 0.0045
  Average Value: 0.0051
CPU 8:
  Latest Value: 0.0049
  Average Value: 0.0047
CPU 9:
  Latest Value: 0.0068
  Average Value: 0.0045
CPU 10:
  Latest Value: 0.0035
  Average Value: 0.0046
This data indicates the proportion of time each CPU core spent in "system" mode over 5-minute intervals. I can provide a more detailed analysis, create a visualization, or filter the data further if you need.

Conclusion
And there you have it! The Model Context Protocol (MCP) is a game-changer, allowing you to connect services like Grafana to multiple AI agents with incredible ease. Forget writing boilerplate code for HTTP requests or wrestling with APIs. With MCP, a few configuration steps are all you need to get your services talking to each other, making powerful integrations more accessible than ever.
If you liked this post, please connect with me on LinkedIn and give me some encouragement. Thanks.

![[Day 30] BMAD-Method Summary](/_astro/banner.C6FR-Le0.png)
![[Day 29] BMAD-Method - Accounting App Flutter - 3](/_astro/banner.pOujF-t4.jpg)